Quadratic function, grade 9, Municipal Educational Institution Secondary School 4 Zapolyarny, 2008. - presentation
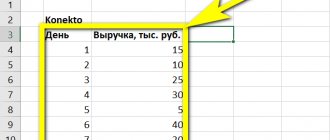
Quadratic function, grade 9, Municipal Educational Institution Secondary School 4 Zapolyarny, 2008.
Quadratic function Definition Definition Definition Graph Graph Graph Properties of the function Properties of the function Properties of the function Properties of the function Graph and properties of the function y = ax 2 Graph and properties of the function y = ax 2 Graph and properties of the function y = ax 2 Graph and properties of the function y = ax 2 Shift of the graph y = ax 2 Graph shift y = ax 2 Graph shift y = ax 2 Graph shift y = ax 2 Methods for constructing a parabola Methods for constructing a parabola Methods for constructing a parabola Methods for constructing a parabola Quadratic function in GIA tasks Quadratic function in GIA tasks Quadratic function in GIA tasks Quadratic function in State Examination tasks Examples and comments Examples and comments Examples and comments Examples and comments State Examination Assignments State Examination Assignments State Examination Assignments State Examination Assignments Summary
Quadratic function A quadratic function is a function that can be specified by a formula of the form Quadratic function is a function that can be specified by a formula of the form y = ax 2 + bx + c, where a, b and c are some numbers, with a 0. y = ax 2 + bx + c, where a, b and c are some numbers, and a is 0. The graph of any quadratic function is a parabola.parabola.
Graph of the function yxa > 0 D > 0 yxa > 0 D = 0 yxa > 0 D 0 yxa
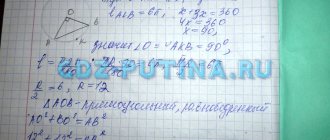
Graph y = ax 2 + bx + c, y = ax 2 + bx + c, D = b 2 – 4ac – discriminant D = b 2 – 4ac – discriminant M(x 0,y 0 ) – vertex of the parabola: M(x 0,y 0 ) – vertex of a parabola: Equation of a parabola passing through point M: Equation of a parabola passing through point M: y = a(x – x 0 ) 2 + y 0 y = a(x – x 0 ) 2 + y 0 x 1, x 2 – roots of the parabola: x 1, x 2 – roots of the parabola: ax 2 + bx + c = 0 ax 2 + bx + c = 0 yx x0x0 x1x1 x2x2 y0y0 M
Properties of the function Properties of the function 1. Zeros of the function: y=0 (intersection with the Ox axis) 1. Zeros of the function: y=0 (intersection with the Ox axis) 2. Points of intersection with the Oy axis 2. Points of intersection with the Oy axis 3. Increasing function (if X 2 >X 1, then f (X 2 )>f (X 1 )): 3. Increasing function (if X 2 >X 1, then f (X 2 )>f (X 1 )): with increasing argument the value of the function increases. Decreasing function (if X 2 >X 1, then f (X 2 ) X 1, then f (X 2 )0 and f (x) 0 and f (x)
Function y=x 2 Let's plot the function y=x 2 xy = x2y = x y0 x y0 x
Function y=ax 2 Let's build a graph of the function y=2x 2 xy = 2x2y = 2x xy = 2x2y = 2x a>0a>0 a0 Let's build a graph of the function y=-2x 2 y=-2x 2 x y x y y=2x 2
Graph and properties of the function y=ax 2 Graph of the function y=ax 2, where a0, y=ax 2y=ax 2 is a parabola with a vertex at the origin; its axis of symmetry is the y-axis; for a>0 for a>0 the branches of the parabola are directed upward, for a>0 for a
Properties of a quadratic function Properties of a quadratic function For a>0 For a>0, the branches of the parabola are directed upward For a
Properties y = ax 2 for a > 0 yxy = x2y = x2 y = 2x 2 y = 0.5x 2 1. D (y) = R 2. E (y) = [0; + ) 3. even, because y(-x) = y(x) 4. Increases on the interval [0; + ) 5. Decreases on the interval (-; 0] 6. The smallest value is 0 at x = 0
Properties y = ax 2 at a
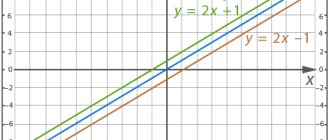
Shift of the graph of the function y = ax 2 along the coordinate axes 1. To construct a graph of the function y = ax 2 + g, you need to move the parabola y = ax 2 along the axis by g units upward if g > 0, or to | g | units down if g 0, or by | g | units down if g 0, or by | p | units to the right if p 0, or to | p | units to the right if p 0, or to | p | units to the right if p 0, or to | g | units down if g 0, or by | p | units to the right if p 0, or to | g | units down if g
Function y = ax 2 + g 1) g > 0 2) g 0) or down (if g
Function y = a(x – р)² 1) р > 0 2) р 0) or to the left (if р
Methods for constructing a graph of a quadratic function 1 METHOD 1 METHOD 2 METHOD 2 METHOD 3 METHOD 3 METHOD Example 1Example 2 Example 4 Example 3 Scheme Example 5
1 METHOD. Scheme for constructing a graph of a quadratic function y=ax 2 -bx+c: Construct the vertex of a parabola. Construct the vertex of a parabola. Draw a straight line through the vertex of the parabola, Draw a straight line through the vertex of the parabola parallel to the ordinate axis - the axis of symmetry is parallel to the ordinate axis - the axis of symmetry of the parabola. parabolas. Find the zeros of the function, if any, and construct Find the zeros of the function, if they exist, and construct the corresponding points of the parabola on the abscissa axis. on the x-axis are the corresponding points of the parabola. Construct additional points. Construct additional points. Draw a parabola through the constructed points. Draw a parabola through the constructed points.
2 METHOD. Construction of a parabola from points with an ordinate equal to the free term of the square trinomial ax 2 -bx+c.
3 METHOD. y=a(xm) 2 + n The graph of the function y=a(xm) 2 +n is obtained by shifting the graph of the function y=ax 2 by m unit segments along the Ox axis and by n unit segments along the Oy axis.
Scheme for constructing a parabola: x y y = x 2 – 4x + 3 Find the coordinates Find the coordinates of the vertex of the parabola: M(2;-1). vertices of the parabola: M(2;-1). Draw the axis of symmetry: x = 2. Draw the axis of symmetry: x = 2. Find the zeros of the function at y = 0: Find the zeros of the function at y = 0: (1;0) and (3;0) (1;0) and ( 3;0) Find additional points: Find additional points: for x=0, y=3; at x=4, y=3. at x=0, y=3; at x=4, y=3. Connect the resulting points. Connect the resulting points.
Example 1 y = 3x x + 9 The graph of the function is a parabola, the branches of the parabola are directed upward, because a = 3, a>0. M(x 0 ;y 0 ) - vertex of the parabola x 0 = ; x 0 = -12 : 6 = -2 y 0 = 3(-2) 2 +12(-2)+9 = -3. M(-2;3) Straight line x = -2 – axis of symmetry Zeros of the function: y=0 3x 2 +12x+9 = 0 x 2 +4x+3 = 0 x 1 = -1, x 2 = y xx y90 2a2a2a2a -bbbb
Example 2 y = ¼ x 2 + 2x – 5 The graph of the function is a parabola, the branches of the parabola are directed upward, because a = ¼, a>0. M(x 0 ;y 0 ) - vertex of the parabola x 0 = ; x 0 = -2 : ½ = -4 y 0 = ¼ (-4) 2 +2(-4)-5 = -9. M(-4;-9) Straight line x = -4 – axis of symmetry Function zeros: y=0 ¼ x 2 + 2x – 5 = 0 x 2 + 8x – 20 = 0 x 1 = -10, x 2 = 2 x0 -2 y y -b-b2a2a-b-b2a2a x
Example 3 Let's plot the function y=x 2 -4x+5. 1) Find the points on the graph that have an ordinate equal to 5. To do this, solve the equation x 2 – 4x + 5 = 5. We get: x 1 = 0, x 2 = 4 1) Find the points on the graph that have an ordinate equal to 5. To do this solve the equation x 2 – 4x + 5 = 5. We get: x 1 = 0, x 2 = 4 2) Points A (0; 5) and B (4; 5) lie on the parabola and have the same ordinate. These points are symmetrical relative to the symmetry axis of the parabola, so the symmetry axis passes through the middle of the segment AB. Because The abscissa of point A is 0, and point B is equal to four, then the equation of the parabola axis is x = 2. 2) Points A (0; 5) and B (4; 5) lie on the parabola and have the same ordinate. These points are symmetrical relative to the symmetry axis of the parabola, so the symmetry axis passes through the middle of the segment AB. Because The abscissa of point A is equal to 0, and point B is equal to four, then the equation of the parabola axis is x = 2. 3) Substitute the value of x into the equation. We get the coordinates of the vertex of the parabola: x 0 = 2, y 0 = 1. 3) Substitute the value of x into the equation. We obtain the coordinates of the vertex of the parabola: x 0 = 2, y 0 = 1. 4) Mark on the coordinate plane t. C (2; 1), construct a parabola passing through three points A, B, C. 4) Mark on the coordinate plane t .C (2; 1), construct a parabola passing through three points A, B, C. y=x 2 -4x+5 AB C 0x 5 y
Example 4 Let's build a graph of the function y=2(x+1) We will proceed as follows: 1) Let's build a parabola y=2x 2 ; 2) Move it 1 unit to the left and 3 units down - the result will be a graph of the given function y=2(x+1) (see figure) The actions that we performed to construct the graph can be described by the following diagram: y=2x 2 y=2(x+1) 2 y=2(x+1) To the left by 1 unit. Down 3 units
Example 5 y=-2(x+3) 2 +2 m = -3 n = 2 y=-2x 2 x 12 y AB M 0x-3 y 2 y = -2(x+3) 2 +2