Task 1. Type 19 OGE in computer science
Student testing data was entered into a spreadsheet. Below are the first five rows of the table:
| A | B | C | D | |
| 1 | district | surname | item | point |
| 2 | C | Student 1 | social science | 246 |
| 3 | IN | Student 2 | German | 530 |
| 4 | YU | Student 3 | Russian language | 576 |
| 5 | NE | Student 4 | social science | 304 |
Column A records the student's district; in column B - last name; in column C - favorite subject; Column D is the test score. In total, data for 1000 students was entered into the spreadsheet.
Complete the task.
Open the file with this spreadsheet (the exam organizers will tell you the location of the file). Based on the data contained in this table, answer two questions.
1. How many students in the Southwestern District (SW) chose social studies as their favorite subject? Write the answer to this question in cell H2 of the table.
2. What is the average test score for Central District (C) students? Write the answer to this question in cell H3 of the table with an accuracy of at least two decimal places.
Task 19_1
Solution
1. Add a filter to the table headers. Filtering the data. We leave the district “SW” and then filter the data in column C. We leave only the subject “Social Studies”. Then select the displayed cells in 1 column. At the bottom of the program window we will get the number of cells. Enter the answer in cell H2
2. Disable the previously installed filtering so that all data is displayed. In column A, set up filtering to display only district “C”. Select column D. At the bottom of the program window, look at the average value. Enter the answer.
Lesson plan on the topic “Spreadsheets” lesson plan in computer science and ICT (grade 9)
Lesson plan on "Spreadsheets"
The purpose of the lesson: to introduce students to the purpose of spreadsheets, basic concepts and simple techniques for working in the Excel spreadsheet program.
Objectives of the lesson: Educational: to familiarize students with the basic concepts of spreadsheets and the possibilities of their application; Educational: nurturing students’ information culture, attentiveness, perseverance, discipline; Developmental: development of thinking, cognitive interests, computer skills.
Equipment: multimedia complex, presentation of a card with a practical task, supporting notes
Lesson type: lesson on learning new material
Lesson plan:
- Organizing time
- Actualization and motivation
- Theoretical part
- Practical part
- Gymnastics for the eyes
- Student Questions
- Homework
- Summing up the lesson
During the classes
1. Organizational moment. Greetings, checking those present.
2. Actualization and motivation. Often when working with documents you have to deal with tables. It is very convenient to process numerical information in a table. Today in the lesson we will look at another application program in the application package - a spreadsheet. Let's learn about its origin, purpose and use. While studying MS Word, we built tables. But only a few operations can be performed with tables in the MS Word editor; it does not allow advanced sorting or establishing any connections between cells. The creation of spreadsheets began in 1979, when two students, Dan Bricklin and Bob Frankston, created the first spreadsheet program on an Apple II computer, which was called VisiCalc from Visible Calculator (visual calculator). The main idea of the program was to place numbers in some cells, and in others to set the law for their mathematical transformation.
3. Theoretical part. (during the presentation of new material, a presentation is used, students make a supporting note in their workbooks). To work with numerical information, a special program is used, called a spreadsheet or spreadsheet processor. In the Office application package, the spreadsheet processor is called Microsoft Excel. Various versions of these programs have been developed, but the basic working methods remain unchanged. Spreadsheets are a program for creating and using documents with automatic calculation of entered data. Like any other program in the Microsoft Office suite, Excel can be launched: from the Start menu, select Programs and then Microsoft Excel. After activating the shortcut, the program is launched, the window of which looks similar to a text editor, which includes a text menu , graphic menu, work field. Here the work field is presented in the form of a table. A document created in a spreadsheet is called a workbook. The individual elements of a book are sheets. The workbook initially contains three sheets, but sheets can be added as needed using the Insert/Sheet command. The working field of a spreadsheet consists of columns and rows. Each column has a letter designation, starting with the letter A. (Letters of the Latin alphabet are used.) And each row has its own number. (Arabic numerals are used.) To identify a cell, a combination of the column name and row number is used and is called the cell address. For example, A1 is the address of the very first cell. The cell in which the cursor is located and highlighted with a frame is called active. You can only influence the active cell. As a whole object, it is a range of cells, which is indicated by the name of the upper left cell and the name of the lower right cell, separated by a colon. For example, A1:D4. The main information objects of a spreadsheet: - number - text - formula You can perform various mathematical operations with numbers in a spreadsheet. To perform calculations, you need to place the cursor in the desired cell and enter the formula. Text is a set of symbols used to design a table (headings, explanations). Text can be used in Boolean expressions. A formula is an expression that gives instructions for mathematical calculations. The expression must begin with an equal sign, which allows the program to distinguish the formula from other data.
4. Practical part. Practical work “Creating a spreadsheet”. (in the application)
5. Gymnastics for the eyes. Complex No. 1. 1). Blink quickly, close your eyes and sit quietly, slowly counting to 5. Repeat 4-5 times. 2). Close your eyes tightly (count to 3), open your eyes and look into the distance (count to 5). Repeat 4-5 times. 3). Extend your right arm forward. Follow with your eyes, without turning your head, the slow movements of the index finger of your outstretched hand to the left and right, up and down. Repeat 4-5 times. 4). Look at the index finger of your outstretched hand for the count of 1-4, then move your gaze into the distance for the count of 1-6. Repeat 4-5 times. 5). At an average pace, make 3-4 circular movements with your eyes to the right side, and the same amount to the left side. Having relaxed your eye muscles, look into the distance at the count of 1. 6). Repeat 1-2 times.
6. Student questions.
7. Homework. Learn the basic concepts of the topic.
8. Summing up the lesson. The guys in a circle speak in one sentence, choosing the beginning of a phrase from the reflective screen in the presentation) I learned the reflective screen... it was interesting... it was difficult... I completed the tasks... I realized that... now I can... I felt that... I acquired... I learned ... I succeeded ... I could ... I'll try ... I was surprised ... the classes were given to me for life ... I wanted ...
Lesson grades.
Task 2. Type 19 OGE in computer science
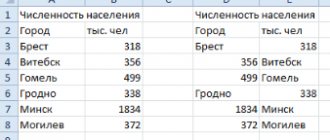
At the weather station, weather data was entered into a spreadsheet. Below are the first five rows of the table, which contains weather data from January 2013 to January 2014.
Each row of the table contains a weather record for one day. Column A records the date; in column B - air temperature; in column C - atmospheric pressure; in column D – wind speed; Column E – cloudiness. A total of 396 days of weather data were entered into the spreadsheet.
Complete the task.
Open the file containing this spreadsheet. Based on the data contained in this table, answer two questions.
1. How many days during this period was the atmospheric pressure below 760 mmHg? Write the answer to this question in cell H2 of the table.
2. What was the average atmospheric pressure on days with air temperatures below 0 °C? Write the answer to this question with an accuracy of at least 2 decimal places in cell H3 of the table.
Task 19_2
Section 3.1 Spreadsheets
Textbook on Computer Science 9th grade Bosova
Read the presentation materials for the paragraph contained in the electronic supplement to the textbook. Use these materials when preparing answers to questions and completing assignments.
Go
Who and when were the first spreadsheets created? (To answer the question, use additional sources of information.)
The generally recognized father of spreadsheets is Dan Bricklin. He, together with Bob Frankston, created the program in 1979, and the concept itself was developed back in 1961 by Richard Mattesich.
As you know, the first computers were specially created to perform all kinds of calculations. The beginning of the widespread use of computers in everyday life was not associated with calculations, which representatives of many professions performed manually until the end of the last century. How can you explain this contradiction?
There were no spreadsheets that made it possible to quickly solve a large number of typical calculation problems by changing the source data.
What do you mean by spreadsheets?
Spreadsheets are an application program for organizing tabular calculations on a computer.
Name the main elements of the table processor window. List the common elements of a spreadsheet window and a word processor window.
The main elements of the table processor window: - title bar - menu bar - toolbar - work area - table cursor - input line
Common elements of the table processor window and word processor window: - title bar - menu bar - toolbar - work area
What spreadsheet processor is installed on your computer? How many rows and columns can spreadsheets created in it have?
Microsoft Excel 2020. 1,048,576 rows and 16,384 columns.
What are table cells called? Why is the name of a cell otherwise called its coordinates?
Cells are named by combining the letter name of the column and the number of the row at the intersection of which it is located. Thus, the name will be unique and the cell name determines its address in the table.
What data can be stored in table cells?
The table cells can store: - Text (Inscriptions, headings, explanations, numbers) - Formula - an expression that specifies the sequence of actions to transform data.
Compare the operations of entering, editing, and formatting text information in a word processor and in spreadsheets.
The operations of entering, editing and formatting text in spreadsheets (Excel) and text editors (Word) are the same. You can change the font, text position, font size and much more.
Compare the ability to enter numbers into tables in a word processor and in a spreadsheet.
In a text editor, the entered number is represented as a string and no numerical operations can be performed with it, but in spreadsheets you can.
One of the cells of the spreadsheet contains the arithmetic expression 50+25/(4*10-2)*8. What mathematical expression corresponds to it?
Formulate rules for entering formulas in spreadsheets.
A formula always begins with an equal sign (=) and can include references (cell names), operation signs (addition, subtraction, multiplication, division, exponentiation), functions, and numbers.
Why are spreadsheets often called dynamic?
I think because the table can change completely when the value of one table cell changes.
Compare spreadsheets and relational database tables: what do they have in common? What is the main difference?
In relational databases: - no two rows can be the same - columns are arranged in a specific order, which is created when the table is created. A table may not have a single row, but it must have at least one column. - each column has a unique name (within the table), and all values in one column have the same type (number, text, date...) - at the intersection of each column and row there can only be an atomic value (one value not consisting of a group values).
Give a brief description of the modes for generating spreadsheets.
— Filling out a document — Editing a document (cell contents: clear, edit, copy, change font, merge, borders, table structure: delete, paste, move) — Formatting
Figure 3.3 shows a fragment of the table in formula display mode. What will this fragment look like in value display mode? Make sure your answer is correct by using the spreadsheet processor at your disposal.
TopParagraph 3.2 ->
Lesson summary “Solving problems using MS Excel” 9th grade
Purpose of the lesson: to strengthen students’ skills in visualizing numerical data in MS Excel, creating tables, drawing up an algorithm for solving a problem in Excel
Objectives: 1. Educational:
- Practical application of the studied material.
- Consolidating knowledge of the general principles of operation of the MS Excel spreadsheet processor and the ability to create the most optimal table structure for solving a specific problem.
- Forming an idea of calculations in a spreadsheet as the most important in the study of computer science and widely used in practice.
Educational:
- Development of individual and group practical work skills.
- Development of the ability to reason logically and make heuristic conclusions.
- Development of skills to apply knowledge to solve problems of various kinds using spreadsheets.
- Development of communicative competence in students;
Educational:
- Fostering a creative approach to work and a desire to experiment.
- Fostering hard work and a sense of respect for science;
- Education of information culture.
- Professional guidance and preparation for further self-education in the chosen profile
Lesson type: lesson on the integrated application of students' knowledge of learning. Lesson format: conversation, workshop Software and hardware for the lesson:
- interactive board;
- multimedia projector;
- computer class;
- MS Excel program.
Didactic support of the lesson:
- Blank files zadanie1.xls, bioritmi.xls
- Handouts – task conditions
- Presentation for the lesson
Total time: 80 minutes. Lesson plan:
- Organizing time
- Communicate the topic, purpose and objectives of the lesson.
- Updating knowledge
- Solving practical problems.
- Summing up / Setting homework
During the classes
I-II. Organizational moment (4 min)
- Hello guys!
(I note those who are absent) Remember, at the beginning of studying Excel, we said that this program allows you to solve problems of a wide variety of nature? Today we will look at examples of using this program in various fields of activity. So, the main goal of the lesson is to solve problems from various areas using MS Excel.
III. Updating knowledge (5 min)
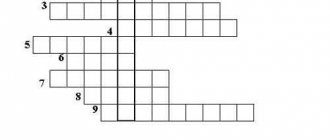
First of all, let's remember the main points of working with Excel. To do this, let's solve the crossword puzzle that you see in front of you. On the right side of the interactive board there is a list of words from which you must select the appropriate ones and paste them into the corresponding cells of the crossword puzzle.
Questions for the crossword:
- Excel uses letters from this alphabet to name columns.
- This type of addressing uses the $ symbol
- Fragment, table range – any rectangular part of the table
- In Excel it always starts with an = sign.
- A6, B9, C13. What is this type of addressing called in Excel?
- Which part of a table in Excel is represented by a letter?
- Minimal spreadsheet element.
Words on the board: text, equals, plus, formula, number, Latin, Russian, lowercase, point, absolute, relative, function, block, cell, column.
(And students read the word vertically for the name of the Excel application)
So, we remembered that excel is a spreadsheet.
Well done boys.
IV. Problem solving.
First, let's do a little warm-up.
Let's divide it into 2 options.
We all love mathematics. Let's do a little math problem using Excel.
Task 1 (5 min) (slide 2): prepare a sheet for calculating the value of the function
A) y=7×2-3x+6 for a given x
B) x=12a2+7a-6 for a given a
Present the results in table form:
| A | B | C |
| 1 | Enter x(a) value | |
| 2 | The function value is | |
| 3 |
Task 2 (15 min)(slide 3-4)
Well, now let’s remember our all favorite cartoon “Vacations in Prostokvashino”. It turns out that you can use Excel here too.
I suggest you solve the following problem, with the help of which we will remember the use of absolute and relative references. Uncle Fyodor, the cat Matroskin and the dog Sharik lived in Prostokvashino in the summer, and mom and dad sent them letters, parcels, telegrams and parcels, which were delivered by the postman Pechkin. Each letter weighed on average - 100 g, each parcel - 5 kg, each telegram - 50 g, each parcel - 500 g. Uncle Fedor received 10 letters, 2 parcels, 10 telegrams, 1 parcel. Cat Matroskin - 4 letters, 1 parcel, 2 telegrams, 1 parcel. The dog ball did not receive a single letter, not a single telegram, but received 4 parcels and 2 parcels. Determine how many kilograms and what kind of mail each resident of Prostokvashino received; how much did all the mail of one type delivered by Pechkin weigh; what total load did postman Pechkin have to carry? Your tasks:
- Choose the optimal table structure to solve this problem
- Enter all the necessary data into the table
- Make calculations using formulas.
After filling out the table, the question is asked: - In which formula will an absolute reference be used and why? (so, for this table option, in the formula contained in cell F2 = B2*$8+C2*$9+D2*$10+E2*$11, since cells B8,B9, B10,B11 in the formulas should not be copied change) (One student does work at the interactive whiteboard, the rest at the computer.) As a result, we get:
Task 3 (10 min) (slide 5-6)
Now imagine the situation: you are going on a hike. How much food do you need to take so as not to be hungry?
To organize a trip, you need to calculate food standards for a group of tourists. The norm of each product for 1 person for 1 day, the number of people and the number of days of the trip are known. It is necessary to calculate the required amount of food for the entire trip for 1 person and for the entire group. Carry out calculations for different initial values of the number of days and tourists.
Product standards are already given in the table. Your task is to choose the right formulas for calculation.
Initially, students are already given the following blank: (on the desktop in the file zadanie1.xls)
slide 5
After which the moment of determining the formula is worked out. It should look like this:
Slide 6
(As work progresses, students’ activities at the computer are checked)
Now let's take a little rest ourselves and give our eyes a rest. Let's do gymnastics for the eyes (2-3 min) (slide 7) 1. Close your eyes, strongly straining the eye muscles, for a count of 1 - 4, then open your eyes, relaxing the eye muscles, look into the distance for a count of 1 - 6. Repeat 4 - 5 once. 2. Look at the bridge of your nose and hold your gaze for the count of 1 - 4. Do not let your eyes get tired. Then open your eyes, look into the distance at the count of 1 - 6. Repeat 4 - 5 times. 3. Without turning your head, look to the right and fix your gaze on the count of 1 - 4, then look straight into the distance at the count of 1 - 6. Repeat 3 - 4 times. 4. Shift your gaze quickly diagonally: up to the right - down to the left, then straight into the distance on a count of 1 - 6; then left up right down and look into the distance at the count of 1 - 6. Repeat 4 - 5 times.
Task 4 (35 min) (presentation) Guys, before we begin solving the next problem, I want to quote the following lines, which belong to Anna Akhmatova: I learned to live simply, wisely, Look at the sky and pray to God, And wander for a long time before the evening, To tire out unnecessary anxiety. Guys, have you ever wondered why our life is like a zebra: today we succeed in everything, but a week later a basic task seems very difficult; Today, despite the cloudy day, we are in a great mood, but after 3 days we are annoyed by everything around us. Scientists have found that human life is subject to three cyclical processes called biorhythms. Physical biorhythm characterizes a person’s vitality, i.e. his physical condition, energy, strength, endurance. The frequency of the rhythm is 23 days. Emotional biorhythm characterizes the state of the nervous system and mood. The duration of the emotional cycle is 28 days. The intellectual cycle determines thinking abilities and the ability to process information. Its cycle is 33 days. This is what biorhythms look like graphically. In each of the three cycles, the first half is favorable for a person, the second is unfavorable, and the intersection of the graph with the x-axis is considered a critical point; on such critical days a person can expect the greatest dangers for himself. It is not necessary to believe that a misfortune is about to happen, but on this day you need to be on alert, since your physical, intellectual or emotional capabilities are reduced. If we look carefully at the graphs, we can conclude that biological rhythms can be described by functions of the form y = sin(2П (t – t0)/Tk) where t is time, Tk is periods, t0 is date of birth. The beginning of all three curves is the birthday t = t0, sin(0)=0. The correspondence between theory and practice is always interesting. The day a person dies can be perceived in different ways. But I think you will agree with me that this is a critical day. Let's look at a few examples of the biorhythms of famous people on the day of their death:
Slide 11,12,13
As we know, S. Yesenin committed suicide. On the charts on December 27 and 28, we see the decline of the emotional cycle.
The graphs show that on the day of death or the day before, these people’s biorhythms are at a critical point. I prepared a poem by Yesenin, written on October 27, 1925, for our little study. The flowers say goodbye to me, bowing their heads lower, that I will never see Her face and my father’s land. Darling, well! Well! I saw them and saw the earth, And this grave trembling I accept like a new caress... And because I comprehended My whole life, passing by with a smile, - I say for every moment, That everything in the world is repeatable. Does it really matter - another will come, The sadness of the departed will not gnaw away, The one who came, abandoned and dear, will compose a better song. And, listening to the song in silence, Beloved with another beloved, Perhaps she will remember me Like a unique flower. So, our goal is to build the biorhythms of a specific person, Sergei Yesenin, and analyze the state of his biorhythms at the time of writing the poem. We already know the formulas for plotting function graphs. The workpiece is already there. Slide 15 As a birthday - the birthday of S. Yesenin, October 3, 1895. Start date of the forecast - October 20, 1925. Cell A7= E3 A8=A7+1, use the autofill marker to stretch it to 30 days. We calculate the number of days lived. B7=A7-$2. But dates are accepted only from 1900. In order to avoid errors, we write the date of birth as 10/3/1900 and B7=A7-$2+ 1826, stretching the formula. We fill in the physical biorhythm =SIN(2*PI()*B7/23), and similarly calculate the emotional and intellectual biorhythms. Let's build a graph: Slide 16 The poem we are analyzing was written on October 27. Emotional biorhythm is a decline, apathy, a pessimistic attitude towards the environment, sadness can be traced. Intellectual biorhythm is a peak, the feeling that the poem was written in one breath, as if the author was simply reasoning in verse, maybe that’s why there is an exact date. Physical biorhythm - a decline in physical activity, endurance and tone of the body decrease, energy gives way to laziness. As we can see, the poem does not refute the theory of biorhythms. Now try to calculate your biorhythms for a month and answer the questions: -Who is experiencing a physical, emotional, intellectual up/down today? -How do you feel this corresponds to the data received? - Choose the days when your answers in class will be the most successful, and when - the least. -Select suitable days to take the physical education test. -Which week of the month is the most favorable? -What other information did you see on the diagram? As an additional task: check people for compatibility (When two people have the same or very similar schedules for one, two or even three biorhythms, then we can assume a fairly high compatibility of these people
V. Summing up. So, today in class we were once again convinced of the versatility of computer technology. Namely, in the capabilities of Excel spreadsheets. We saw that with the help of this program it is possible to solve mathematical, biological, and optimization problems, we remembered how the optimal table structure is selected, how different types of links are used. Those. The goal of our lesson has been fully achieved. For homework, I suggest you choose any discipline and create a task using MS Excel. End of lesson. Grading. Thanks everyone for your work. Goodbye.
List of used literature:
- Computer Science 9th grade / Edited by I.V. Makarova - St. Petersburg: Peter Kom, 1999
- Computer science. 7-9 grade. Basic course. Workshop-problem book on modeling / Ed. N.V. Makarova. – St. Petersburg: Peter, 2003
- Computer science. Problem book-workshop in 2 volumes /Ed. I.G. Semakina, E.K. Henner: Volume 2. – M.: Binom. Knowledge Laboratory, 2003
- Zlatopolsky D.M. 1700 tasks in Microsoft Excel. - St. Petersburg: BHV - St. Petersburg, 2003
- Yesenin A.S. I am a Moscow mischievous reveler: Poems. – M.: Eksmo, 2007
