Calculation tables
Calculation tables are a form of computational task, meaning students perform calculations directly on the table. This is how schoolchildren repeat the components of actions and compositions of numbers, work with factors, dividends, differences, remainders, etc.
Examples of tasks
1 class
What numbers are missing?
| Minuend | 8 | 6 | 8 | 7 | |
| Subtrahend | 3 | 4 | 4 | ||
| Difference | 1 | 4 | 6 | 4 | 1 |
2nd grade
Name the numbers that are missing in each table.
| Factor | 2 | 2 | 8 |
| Factor | 9 | 2 | 3 |
| Work | 18 | 10 | 16 |
| Dividend | 12 | 8 | 18 |
| Divider | 6 | 9 | 2 |
| Private | 4 | 7 |
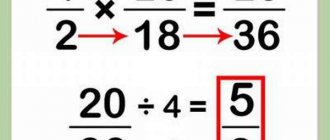
Complete the sentences.
- If the product of two numbers is divided by one of the factors, you get....
- If you multiply the divisor by the quotient, you get...
- If you divide the dividend by the quotient, you get...
- If you divide the dividend by the divisor, you get...
3rd grade
What numbers are missing in the table?
| Dividend | 19 | 61 | 52 | 90 | 236 | 629 |
| Divider | 2 | 13 | 8 | 10 | 100 | |
| Private | 9 | 3 | 100 | 3 | 6 | |
| Remainder | 9 | 10 | 13 | 12 | 6 |
4th grade
Calculate orally and decipher the name of the science. What is she studying?
Mathematics. 4th grade. Final examination. Basic and advanced difficulty levels.
The workbook is intended to evaluate the performance of primary school graduates in mastering a mathematics course. It includes 10 variants of tasks at two levels of difficulty. Many tasks are based on real-life situations. The manual will assist primary school teachers in organizing diagnostic procedures.
Buy
Anchor Charts in the Classroom: What They Are and Why You Should Try This Method
Vacations are a time not only for relaxation, but also for teacher reflection. What didn’t work out last year, how to change the situation, what methods to use for this? For those who are asking these questions right now, we are telling you about anchor charts - you just have time to study the issue in detail, get inspired by successful works (we provide links!) and practice creating your own.
Hello teacher! Newsletter
For those who work at school and love their profession very much
What are anchor charts?
These are visualizations that help children (including preschoolers) find out what awaits them today, or consolidate what they have learned through the main points and blocks that are succinctly and clearly presented.
They are great for laying the foundation for a new unit of study and providing an overview of concepts. They also make it easy to break down complex concepts into easily digestible chunks.
Diagrams are good for reflection - when you need to summarize what we learned, what we learned, what was difficult and what was easy. This is a way to give (and receive) feedback. It’s enough to just make one template, hang it in the classroom, and then change it. Or each student can create such a template for themselves so that they can work with it together with the teacher or even without him.
Photo: Teacher Trap
What should the diagrams look like?
It is advisable that they be quite simple! Don't try to fit your entire lesson or activity into a chart (or all of your preschool guidelines). The chart is a quick way for your child to get information, so don't overload it. The same principle as in presentations: you shouldn’t try to convey all your experience and knowledge on one slide.
It is desirable that they be colorful and structured. Before creating a chart, think about how many boxes you want to put on it, and then think about the design. Of course, both preschoolers and primary schoolchildren prefer those with not only words and arrows, but also, for example, illustrations.
Do you think this is very difficult? Do you need imagination, talent for drawing, etc.? But it is not so. This is not a situation where you should be shy about borrowing. Just go to Pinterest, for example - there you will find dozens of already created diagrams, the ideas of which you can use to create your own. Here, for example, is a simple anchor picture for preschoolers - how to behave in class. But here the teacher very simply explains how to make such objects together with the students.
What is important
There is no need to repeat the same thing over and over again. Plus, sometimes it’s worth involving the children themselves in creating such diagrams. For example, if you want to reinforce some material, help children work here and now in class.
There are several types of these diagrams that can be used in math lessons. Some can help in organizing the lesson itself, others will be useful during class work - this is a focus on what is new in the material, the concepts being introduced. The third type of diagrams will help children learn to think strategically (for example, a diagram for mastering multiplication may include several strategies and focus on one specific one).
Three things to help you get started:
- Define your goal. For its own sake, a diagram is worthless. What do you want to achieve? So that students remember something? Then what is the most important thing about this?
- Come up with a design. It sounds difficult, but! Here you don’t even have to reinvent the wheel. Feel free to borrow ideas from your colleagues. Search the Internet, visit other teachers' classrooms.
- Involve students. And this is where real magic can happen. Ask the children to think and brainstorm on the topic you have given and related to the diagram. And then add yours and theirs to the table.
What else is worth paying attention to
Well, of course, on where your “poster” will be placed. Do you do it only on paper or do you want to use it electronically as well?
In the classroom and preschool group, the diagram should be in a visible place, otherwise what is the point of it? If you're hanging several of these posters, think about their placement so you don't create a mess of colors on the walls that will confuse the kids. For primary school, it is good to organize diagrams by subject, but in secondary school it is organized by units and concepts that correspond to the program.
Photo: Teaching With Simplicity
What else is important? Even if you really like the diagrams and you are convinced that they work, you should not overuse them. There is no need to make diagrams for every day, lesson, activity. Choose those items that need to be secured. And just remember that even in anchor charts, the recency effect works great. And if you do them every day, the children will get used to it and that same wow factor in perception will stop working.
Math lesson on "Diagram"
Open mathematics lesson 1st grade
Report of the base site according to Federal State Educational Standards
Lesson topic: “The concept of a diagram”
The purpose of the lesson:
Form the concept of a diagram, an idea of reading data in a diagram.
Develop thinking and logical operations, skills to work and transform
scientific information.
Develop the ability to communicate in a group
During the classes
- Organizing time
As hospitable hosts, let us greet our guests today, turn to them and smile.
And now, turn to each other, put your palms together, feel how warm and pleasant you feel, try to work together in the same way until the end of the lesson.
I suggest you guess the riddle now.
If the night is clear, the air is transparent,
Then we see the sky... (in the stars).
Today we will arrange a starfall. More on this a little later.
II Numerical warm-up
Let's work with numbers. There is a group of numbers on the board (continue and write the next 2 numbers)
Level 1: 8 6 … 4 7 …
Level 2: 2 6 3 6… 8 3 7 2…
Write down the numbers 14, 8, 20, 23, 30, 8, 60, 16, 9, 100
What tasks do you propose to complete with these numbers? (write in ascending order; underline the even ones, circle the odd ones; underline the round ones)
Summarizing. Self-esteem in the table
- Mathematical warm-up - individual work (multi-level tasks)
The teacher distributes cards for individual work. Each card has a different colored star attached to it. Having completed the task, the student raises the card so that the teacher sees the color of the star and gives the corresponding key. Children check their answers using the key and evaluate themselves.
.
| 8 + 6 = | 14 | 5 + 9 = | 14 |
| 15 – 7 = | 8 | 38 – 30 = | 8 |
| 21 – 1 = | 20 | 25 – 5 = | 20 |
| 16 + 7 = | 23 | 26 — 3 = | 23 |
| 38 – 8 = | 30 | 31 – 1 = | 30 |
| 38 – 30 = | 8 | 18 – 10 = | 8 |
| 90 – 30 = | 60 | 40 + 20 = | 60 |
| 8 + 8 = | 16 | 15 + 1 = | 16 |
| 18 – 9 = | 9 | 5 + 4 = | 9 |
| 80 + 20 = | 100 | 99 + 1 | 100 |
- Geometric warm-up
rectangles
What mistakes did the children make when filling out the table in accordance with the task: “From a given set of figures, write down the numbers of rectangles, squares, polygons”: | ||
| squares | polygons | |
| Children 3; 5 we - | Children 2; 7 we - | Children 4; 6 we - |
What is the reason for the mistakes made?
Summarizing
- A PROSPECTIVE IMMEDIATION IN THE THEORY.
H
diagram
what did we use when recording the results of work on geometric material? (table)
The word appears on the board
What can you say?
Do you want to know?
Chart information cards. Working with insert.
* I already knew about this + new for me
? I don't understand, I have questions
In newspapers, magazines, reference books, and encyclopedias, tables, diagrams, and graphs are often provided to present various information. They help convey this or that information briefly and clearly.
A diagram
is a visual graphic representation of information
where several quantities or several values are compared
one value, where you can track changes in this
quantities.
In elementary school we will get to know different
types of diagrams.
Diagrams
linear circular columnar
And in first grade we will only get acquainted with the columnar
a diagram that
serves to compare several quantities.
They consist of columns, the height of which is determined
values of the compared quantities.
- Who already had an idea about the diagram?
- Who doesn't know what this is?
How many problems did first-graders solve? What about inequalities? How many expressions were solved to find the sum and difference. How many more problems were solved than inequalities?
Let's now try to create an algorithm, what needs to be done to build a diagram
To build a bar chart you need:
1) depict a rectangular coordinate system,
2) select a single segment on the OU axis
3) draw columns whose height corresponds to the data from the condition
4) sign the names of
the quantities being compared.
Practical work
Group work
1 group
(cubes)
Many of our guys participate in clubs. In vocal - 2, in dance - 7, and in cutting and sewing - 3.
Draw the number of children who study in the circle.
2nd group
(cells on a sheet of paper)
In the Russian language lesson, the guys received 7 A's, 5 B's, and 2 C's. Draw marks on a piece of paper.
Group 3
(pyramids)
For her birthday, mom bought 8 pears, 5 apples, 4 oranges and 2 kg of grapes. Draw the number of fruits
4 group
(construction material)
Natasha read 5 books about friendship, Sveta 4 books, and Olya read 2 books less than Natasha and Sveta together.
Draw the number of books the girls have read.
(educational moment)
5 group (
work on the questions and write down the answers)
Summing up the work of the groups.
Summing up the lesson “Starfall”, if you collect more red stars, then you glue it, more blue ones, then you stick it on blue.