Mathematics lesson on the topic Diagrams in 6th grade
Summary of a 6th grade math lesson on the topic “Diagrams.”
Author: Smirnova Larisa Vladimirovna, teacher of the Bolshekoshinsky secondary school, Tver region, Selizharovsky district, Bolshaya Kosha village Description of the material: I propose the development of a mathematics lesson using interactive teaching techniques in the 6th grade on the topic “Diagrams”. This material will be useful to mathematics teachers who teach using the textbook by I. I. Zubareva, A. G. Mordkovich. Purpose of the lesson: to introduce the concept of a diagram, different types of diagrams; teach students to read diagrams by answering questions. Equipment: computer, projector, handouts. Methodological techniques: conversation - dialogue, game situation, work in small groups.
Progress of the event.
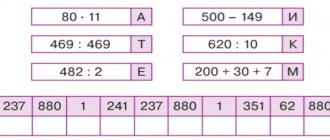
Motivation. Every day we have to work with a huge amount of information. It is impossible to remember all the information that comes to us. Therefore, we write down what is most necessary for us. Moreover, we try to record it in such a way that it would be easy for us to use this information later – to select the necessary data, to compare something. A table is the easiest way to organize your data. We are already familiar with some tables (multiplication table, lesson schedule, diary page). Tables are convenient for organizing and searching data (they make it easier to find the necessary information, do not force you to study all the available information, but immediately find what you need, make it easy to compare similar information and make the necessary choice). However, they do not provide a visual representation. Therefore, today we will get acquainted with another way of presenting information, which is in many ways more convenient and clearer than a table. To find out the topic of our lesson, you need to solve a simple encryption. You can easily complete the task if you remember how to factor numbers into prime factors.
Report the topic and objectives of the lesson. So, the topic of our lesson is “Diagrams, reading diagrams.” Today in the lesson we will learn: what a diagram is, what types of diagrams exist, how to read diagrams correctly. Learning new material. You conducted a survey among students in grades 4-9 on the topic “Favorite time of year” and provided me with a table. I made a diagram based on this table.
Compare the table and diagram. 1. In your opinion, is it more convenient to compare data using tables or charts? 2. Which way of presenting information is the most vivid and visual - in the form of a table or a diagram? Diagrams are used when they want to present some information visually. Charts are often used in newspapers, magazines and books to illustrate various data. Charts make it easier to compare data than tables. Let's write down the definition of a diagram. Diagram (translated from Greek diagramma - image, drawing, drawing) is a graphic image that clearly shows the relationship of any quantities.
There are many types of charts: columnar, linear, circular, cone; cylindrical. The type of diagram depends on which geometric figure represents the information.
Let's look at Figure 8. In it, information about the distribution of expenses per person per month is given in the form of a diagram. What information do you think is horizontal in this diagram? (Type of expenses) What about vertically? (Amount of expenses) What shapes represent the types of expenses in the diagram? (Columns) What could such a diagram be called? (Columnar)
Let's look at Figure 9. What shapes represent the types of expenses in this diagram? (Lines) What could such a diagram be called? (Linear)
Let's look at Figure 10. What shapes represent the types of expenses in this diagram? (Cones). What might such a diagram be called? (Cone)
Let's look at Figure 11. What shapes represent the types of expenses in this diagram? (Cylinders). What might such a diagram be called? (Cylindrical)
Consider Figure 12.
What shape represents the types of expenses in this diagram? (Circle). What might such a diagram be called? (Circular). What is the difference between a pie chart and all the others? (The circle is divided into shares (parts). Each part is a certain type of expense) Interactive exercise. Explanation of the rules for performing the interactive exercise: Now we will learn to read diagrams. To do this, I suggest you play the Interview game. You will play the role of journalists, that is, ask me questions, and I will be an extra - answer your questions. (The children are offered ready-made questions on cards, the teacher answers the questions posed, showing how to read from the diagram)
Questions for the chart:
What time of year do umbrellas sell best?
(summer) At what time of year are umbrellas the worst sellers? (in winter) At what time of year are mittens not sold? (summer) At what time of year do mittens sell best? (in winter) Which product sells approximately the same at all times of the year? (gloves) What sells better in spring – gloves or mittens? (gloves) How many times do mittens sell better than umbrellas in winter? (2 times) How many times are umbrellas better sold in summer than gloves? (9 times) What product sells equally in spring and summer? (bags) Perform an interactive exercise. Now I suggest you play this game in pairs. Your task is to discuss the questions and write the answers in your notebook. Next, you must answer these questions at the board in the form of an interview. Questions for diagrams.
Vitamin A content (mg per 100 g)
Is it true that carrots are the main source of vitamin A? Arrange food products in order of the amount of vitamin A they contain. Which product has the first place in the amount of vitamin A? Which product has the last place in the amount of vitamin A? How much more vitamin A does green peas have than blackcurrants? How much less vitamin A is in dry rose hips than in carrots? How many times more vitamin A do carrots contain than red peppers?
Vitamin C content (mg per 100 g)
Is it true that lemon is the main source of vitamin C? Which food contains the most vitamin C? Which food contains the least amount of vitamin C? How many times more vitamin C does dry rosehip contain than lemon? How many times less vitamin C does an orange contain than dry rose hips? Which product has the second highest amount of vitamin C? How much more vitamin C does red pepper have than black currants?
The amount of revenue of a trading enterprise (in thousand rubles) for various goods.
What time of year do dresses sell best? What time of year does skirt sell the worst? What product sells best in spring? What product sells the worst in spring? What product sells best in winter? What product sells worst in winter? How many times are skirts better sold in spring than in winter? Which product is least popular in autumn, winter and spring?
The amount of revenue of a trading enterprise (in thousand rubles) for various goods.
What time of year do bananas sell best?
What time of year is the worst time for oranges to sell? What product sells best in the fall? What product sells the worst in summer? What product sells best in spring? What product sells best in summer? How many times are bananas sold better in winter than in autumn? Which product is the least popular at all times of the year? Reflection. Continue the sentence: Today I learned…. Today I learned... I would like to learn in the future... Answer the questions:
What is a diagram?
What types of diagrams are there? What do tables and charts have in common, and what are the differences? Would you like to learn how to make diagrams yourself? Assessment. Self-esteem. Try to evaluate your work and the work of your group in a few words. What happened? What else needs work? Homework: paragraph 34, No. 1028 (a, b), pp. 229-230 counter. tasks No. 2,3
We recommend watching:
Summary of a mathematics lesson for the 6th grade of a correctional school of the VIII type on the topic: Speed. Time. Dist Game “Field of Miracles” in mathematics for students of grades 5-6 of correctional schools of the VIII type Extra-curricular activity in mathematics for students of correctional schools of the VIII type Summary of a mathematics lesson in grade 5 “Journey to the land of Mathematics”
Similar articles:
Game as a means of interactive learning in the subject Mathematics
Summary of a 6th grade math lesson on the topic: Multiplication and division of ordinary fractions
Extracurricular math activity for 7th-8th grade students. Game "Weak Link"
Summary of a 9th grade mathematics lesson on the topic: Arithmetic and geometric progressions
Summary of a 5th grade math lesson on the topic: Multiplication and division of decimals by natural numbers
Diagramming tasks
1 option
1. Construct a pie chart reflecting the following conditions:
A) there are 18 girls and 12 boys in the class B) the alloy contains 120g of tin and 60g of lead
C) the alloy contains 100 g of tin, 70 g of lead and 10 g of impurities D) out of 480 apartments, 48 are one-room, 240 are two-room, and the rest are three-room
D) According to the test results, 5 students received a grade of “5”, 16 students received a grade of “4”, the remaining 9 students received a grade of “3”. Build a diagram.
E) There are 24 students in the class, 6 are in the music school, 12 in the sports school, and the rest in the art school. Build a diagram.
Option 2
1. Construct a pie chart reflecting the following conditions:
A) there are 15 girls and 21 boys in the class B) the alloy contains 70g of tin and 110g of lead
C) the alloy contains 90 g of tin, 30 g of lead and 60 g of impurities D) of the 480 apartments in the house - 96 are one-room, 120 are two-room, and the rest are three-room
D) According to the test results, 4 students received a grade of “5”, 12 students received a grade of “4”, the remaining 16 students received a grade of “3”.
E) There are 36 students in the class, 8 are studying in a music school, 18 in a sports school, and the rest in an art school. Build a diagram.
2. Show on the diagram that 40% of the class has grades “4” and “5”, and the rest of the class has grades “3” in various subjects